Persistent Fund Alpha and Active Manager Skill
Qiang Bu, author of the study “Do Persistent Fund Alphas Indicate Manager Skill?”, which appears in the Fall 2017 issue of The Journal of Wealth Management, examined whether long-term fund alphas come from manager skill or luck.
His study covered the 20-year period 1993 through 2012, and included 476 U.S. mutual funds that existed through the full period. (Note there were more than 1,000 U.S. equity funds at the start of the period.) Using a group of bootstrapped winner funds as his benchmark, he compared this benchmark to actual winner funds over the period.
Bu found evident differences among funds with regard to return distribution properties, market exposure, alpha consistency and portfolio holdings. In addition, persistent winner funds exhibited fund-specific characteristics distinct from those of other funds. He concluded that persistent fund alpha is earned by manager skill instead of pure luck.
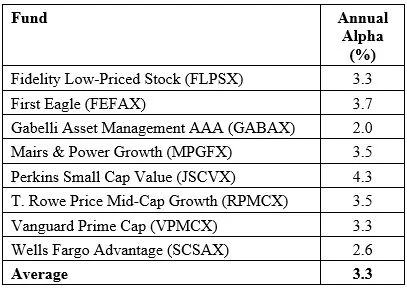
The following table presents the study’s list of winner funds that produced a statistically significant (at the 5% level) 20-year alpha and their associated annual four-factor (market beta, size, value and momentum) alphas. The t-stats of the alphas were all between 2.2 and 2.9.
While the average annual alpha of 3.3% for the winners is very impressive, perhaps the most interesting finding is that, of the more than 1,000 actively managed funds that existed at the start of the 20-year period, Bu was able to identify just eight that produced statistically significant alphas at the 5% level. Using that same 5% level of confidence, we randomly would expect to have found 25 that outperformed. Thus, only about one-third of the number of funds we should expect to outperform purely by chance actually did.
Outperformance Less Than Randomly Expected
This finding of fewer statistically significant winners than would be randomly expected is consistent with prior research.
For example, in their study “Luck versus Skill in the Cross-Section of Mutual Fund Returns,” which was published in the October 2010 issue of The Journal of Finance, Eugene Fama and Kenneth French found fewer active managers (about 2%) were able to outperform their three-factor (market beta, size and value) model benchmark than would be expected by chance.
Similarly, in his August 2016 study, “Mutual Fund Performance through a Five-Factor Lens,” which covered 3,870 active funds over the 32-year period 1984 to 2015, Philipp Meyer-Brauns of Dimensional Fund Advisors found that, after benchmarking returns to the Fama-French five-factor model—adding profitability (RMW, robust minus weak) and investment (CMA, conservative minus aggressive)—to the Fama-French three-factor model, just 2.4% of the funds had alpha t-stats of 2 or greater, less than the 2.9% we would expect by chance.
Meyer-Brauns extended his work in his March 2017 paper, “Luck vs. Skill across Different Fund Categories.” He examined four separate categories of U.S. equity mutual funds (large-cap value, large-cap growth, small-cap value and small-cap growth) over the period January 2000 through June 2016. His goal was to determine whether active managers’ ability to outperform the Fama-French five-factor model varies across fund categories.
He found that in two of the four categories, large-cap value and large-cap growth, not a single fund had an alpha t-stat above 2. For the two other categories, small-cap value and small-cap growth, the percentage of funds with alpha t-stats of 2 or higher, at 1.8% and 1.1%, respectively, was lower than would be expected by chance.
In light of the evidence that fewer active funds deliver statistically significant alphas than would be expected purely by luck, an interesting question to ask is this: How would investors have known ex-ante which of the more than 1,000 active funds they had to choose from at the start of the period Bu examined would be among the eight that would produce statistically significant alphas?
Given that investors cannot spend alpha, only returns, I thought it would be interesting to see how these winners (in hindsight) performed relative to passive strategies that investors could have chosen as an alternative.
Performance Relative To Index Strategies
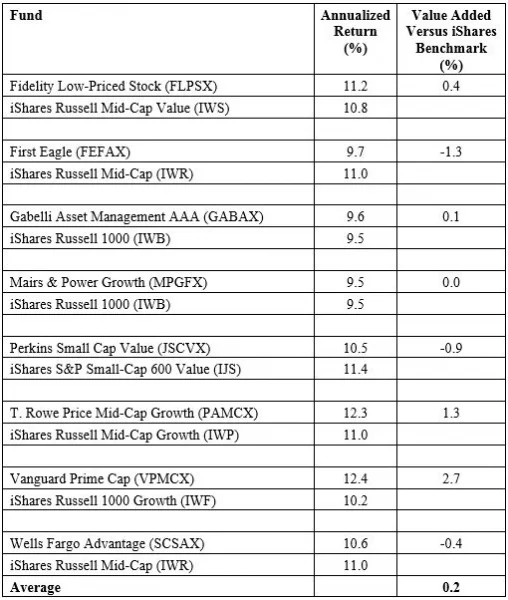
Using Morningstar’s asset categorization, I use the iShares ETF from the same asset class to compare performance. Morningstar provides returns for the 15-year period ending June 6, 2018, which includes the out-of-sample period post-2012. Thus, the in-sample period, and that bias, accounts for about two-thirds of the full data sample.
Three of the eight funds (or 37.5%) produced lower returns than their iShares ETF competition, one matched its benchmark and one outperformed by just 0.1 percentage point. The eights funds’ once-impressive average alpha of 3.3% dropped to a far less impressive 0.2%. Given that actively managed funds’ greatest expense for taxable investors typically is taxes, it seems likely the pretax alpha would have been notably reduced on an after-tax basis.
There’s another point worth noting. While indexing is a good strategy, there are well-known negatives to pure indexing that result from efforts to eliminate tracking error. In addition, passive funds that aren’t pure index funds can design their construction rules to create larger exposure to factors that have been shown to deliver premiums (such as size and value).
These advantages are why the vehicles my firm recommends when building portfolios, while they are passively managed (no individual stock selection or market timing), are not index funds. Instead, our vehicles of choice are structured portfolios from AQR Capital Management, Bridgeway Capital Management and Dimensional Fund Advisors (DFA). (Full disclosure: my firm, Buckingham Strategic Wealth, recommends AQR, Bridgeway and Dimensional funds when constructing client portfolios.)
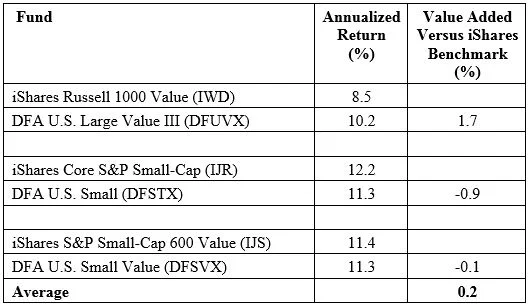
The following table shows returns for the comparable domestic iShares ETFs and Dimensional funds for the same 15-year period ending June 6, 2018:
Dimensional’s structured portfolios outperformed their comparable iShares ETFs by an average of 0.2 percentage points.
Out-Of-Sample Performance
One of the reasons for the well-documented lack of persistent outperformance is that successful active management sows the seeds of its own destruction as cash inflows increase the hurdles to generating alpha. With that in mind, using the regression tool available at Portfolio Visualizer, I’ll review the performance of Bu’s eight superstar funds in the post-2012 period.
I’ll examine the same four factors (market beta, size, value and momentum) that Bu considered, as well as the funds’ six-factor alpha, adding in the newer factors of quality and low volatility. I used AQR’s factors for consistency purposes. Note this is a relatively short period, raising the hurdle for statistical significance.
When using the four-factor model, the funds’ average alpha fell from the impressive 3.3% Bu found to just 0.3% in the out-of-sample period. In addition, four of the eight funds generated negative alphas.
The evidence is even worse when using the six-factor model, as the average outperformance totally disappears. Now we find five of the eight funds generated negative alphas in the out-of-sample period.
There’s one more interesting analysis we can perform. We can look at the in-sample performance of the eight winners from the view of a six-factor analysis. It’s important to note that the two additional factors, quality and low beta, were not used in factor analysis prior to 2012.
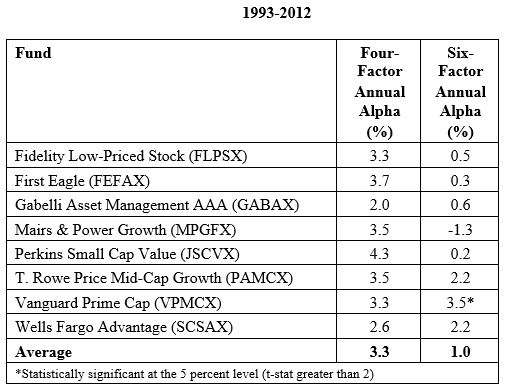
The following table shows the four-factor alphas that Bu found over the period 1993 through 2012, as well as the six-factor alphas I found using the tool at Portfolio Visualizer. The purpose of the analysis is to determine whether the four-factor alphas were generated by exposure to the newer factors of quality and low beta.
What we find is that the average alpha of the eight winners fell from 3.3% to 1.0%, and instead of all eight funds showing statistically significant alphas, now just one fund did so. In other words, much of the eight funds’ outperformance is explained by their exposure to the quality and low-beta factors. In the case of the Mairs & Power Growth fund, a 3.5% alpha became a negative 1.5%. In other words, more than 100% of its four-factor alpha was explained by the fund’s 0.62 exposure to the quality factor.
It’s important to understand that this doesn’t take anything away from the performance of that fund. After all, the fund was taking advantage of the quality factor well before academics uncovered and defined it. However, today, there are funds that provide exposure to that factor, such as the iShares Edge MSCI U.S.A. Quality Factor ETF (QUAL).
Summary
Bu’s finding that only eight of the thousands of funds that existed at the start of his sample period managed to produce statistically significant alphas is pretty damning evidence against the likelihood of an investor selecting actively managed funds that will outperform.
In addition, while the eight winners averaged a very impressive annual alpha of 3.3%, over the more recent, 15-year period we examined, they provided pretax returns just 0.2 percentage points higher than a low-cost, highly tax-efficient portfolio of indexed ETFs. That is not a lot of pretax alpha given the risks of underperformance—especially because, for the typical actively managed fund, the greatest expense for taxable investors is taxes.
We also saw that the performance of Bu’s eight winners deteriorated dramatically in the post-sample period. All of this evidence provides support for legendary investor Warren Buffett’s advice to investors when choosing between active and passive funds, delivered in Berkshire Hathaway’s 1996 annual report: “Most investors, both institutional and individual, will find that the best way to own common stocks is through an index fund that charges minimal fees. Those following this path are sure to beat the net results (after fees and expenses) delivered by the great majority of investment professionals.”
This commentary originally appeared June 20 on ETF.com
By clicking on any of the links above, you acknowledge that they are solely for your convenience, and do not necessarily imply any affiliations, sponsorships, endorsements or representations whatsoever by us regarding third-party Web sites. We are not responsible for the content, availability or privacy policies of these sites, and shall not be responsible or liable for any information, opinions, advice, products or services available on or through them.
The opinions expressed by featured authors are their own and may not accurately reflect those of the BAM ALLIANCE. This article is for general information only and is not intended to serve as specific financial, accounting or tax advice.


